How Things Were · 1929
1929: A boom year ends in a market crash
The year of confident spending, expanding Ford choices and a devastating autumn market crash.
The year began with the consumer energy of the late 1920s and ended with a severe shock to confidence. The change was not instantaneous for every household. A worker with steady employment might continue buying groceries and visiting theaters after October, while a family dependent on a failing business or investment income could feel the impact much sooner. Reading the year as a single uninterrupted boom—or a full year of Depression—misses that transition.

What everyday things cost
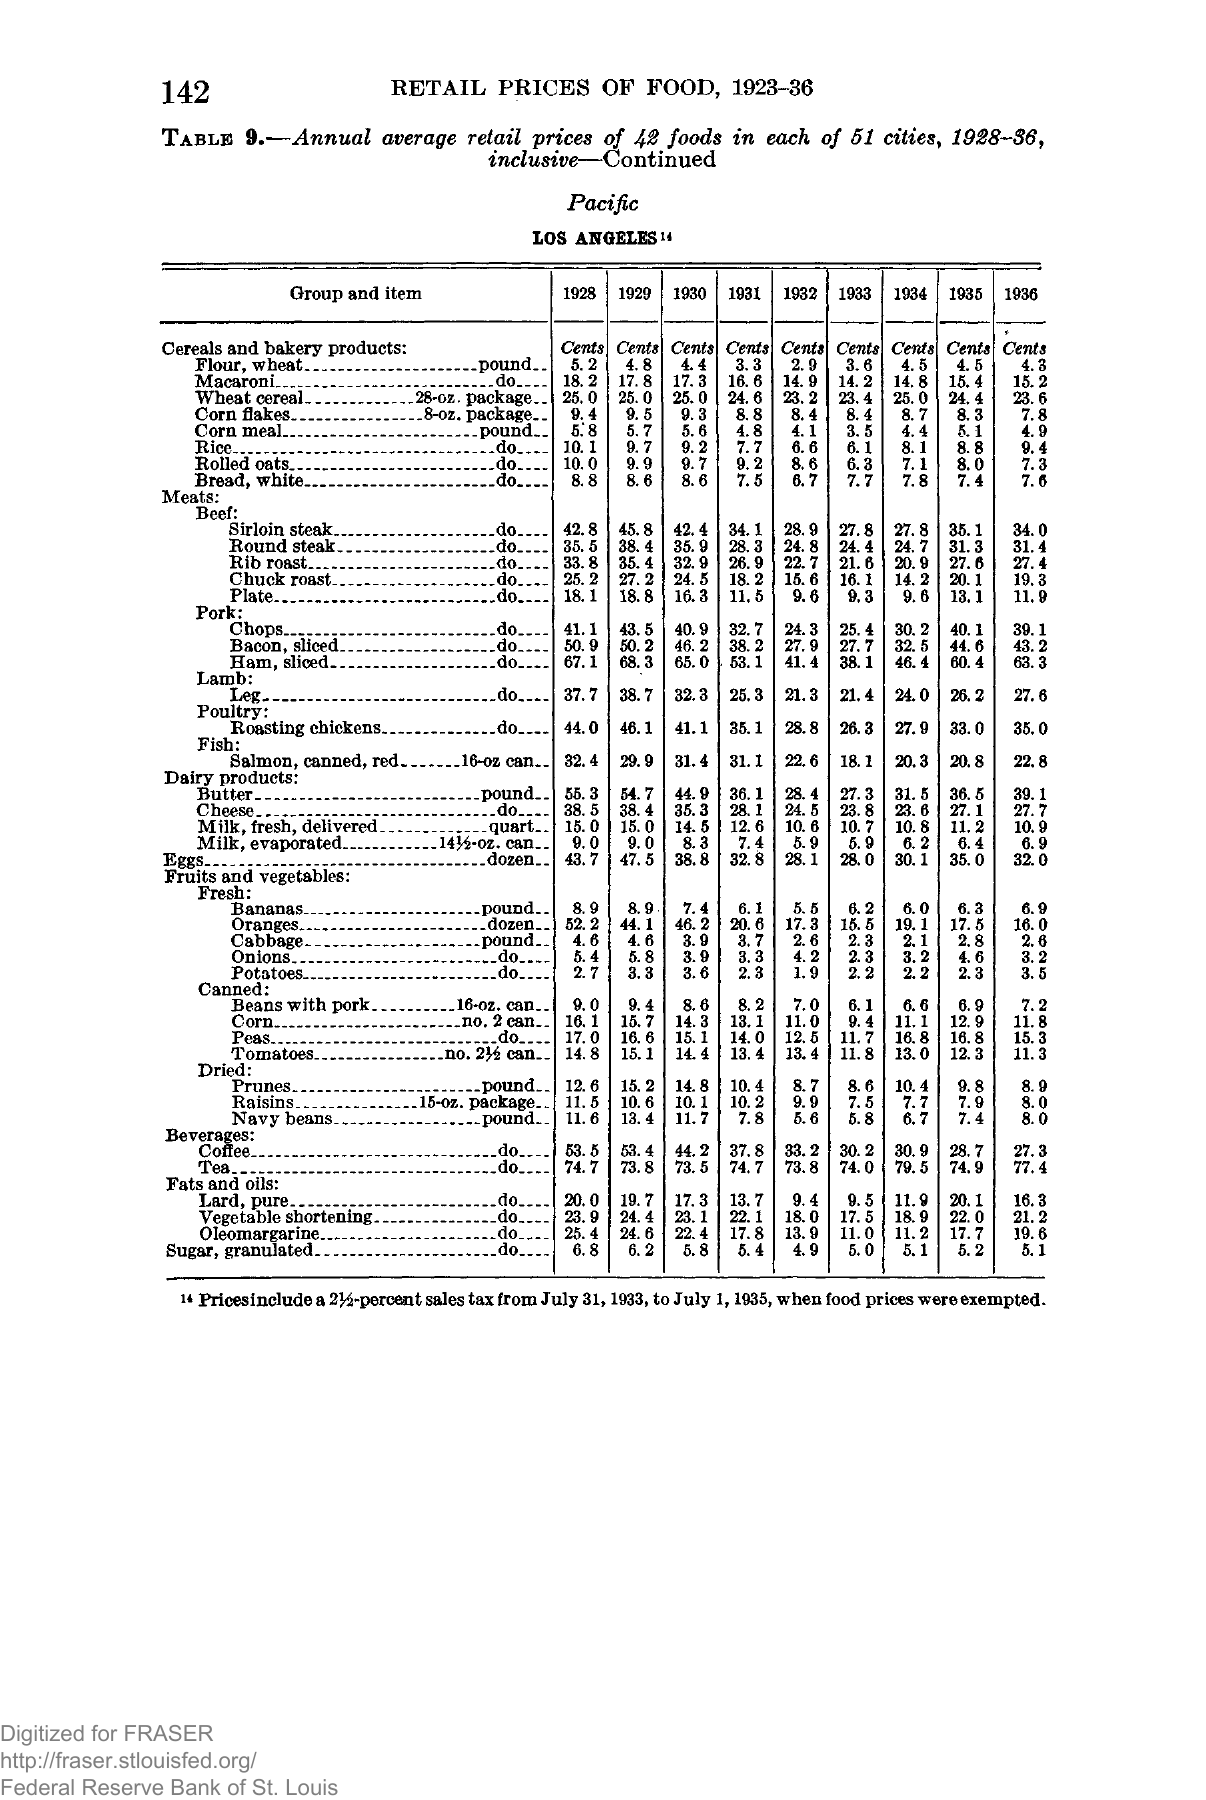
These are original dollars. Grocery prices below are annual Los Angeles averages, not national prices or a single store’s special. Bread is priced by the pound: the loaf example is a one-pound white loaf. Milk is delivered fresh milk sold by the quart.
| Grocery item and unit | 1929 Los Angeles price |
|---|---|
| Bread, white — one-pound loaf | 8.6¢ |
| Fresh milk, delivered — quart | 15¢ |
| Milk — gallon equivalent (4 quarts) | 60¢, calculated |
| Eggs — dozen | 47.5¢ |
| Butter — pound | 54.7¢ |
| Coffee — pound | 53.4¢ |
| Sugar — pound | 6.2¢ |
| Potatoes — pound | 3.3¢ |
| Sirloin steak — pound | 45.8¢ |
| Bacon, sliced — pound | 50.2¢ |
| Oranges — dozen | 44.1¢ |
Sources: BLS, Retail Prices of Food, 1923–36, Table 9, p. 142
Gasoline and the cost of using a Ford
| Gasoline, U.S. gallon | 1929 city-series average |
|---|---|
| Before state/federal tax | 17.92¢ |
| State/federal tax component | 3.50¢ |
| Price including those taxes | 21.42¢ |
This historical series covers 50 representative cities and averages first-of-month quotations. Local taxes are excluded. It is a comparison series, not the pump price at every station. Fuel grade, place and price competition could produce a different local amount.
A ten-gallon purchase at that tax-inclusive average would cost about $2.14. This is a calculation from the series, not an advertised fill-up. A driver also needed oil, tires, maintenance and registration; the fuel bill alone did not describe the full cost of ownership.
Sources: Hillary J. Fisher, MIT thesis (1938), Appendix A, Table XI; Automobile Facts and Figures (1937)
A movie ticket
| Documented example | Admission |
|---|---|
| 1929 local theater example | 25¢ daytime; 35¢ evening, Baltimore example |
A reproduced 1929 advertisement for A Woman of Affairs at Baltimore’s Valencia Theatre shows 25 cents for daytime admission and 35 cents in the evening. Film titles help date the example, but one theater’s scale cannot establish a national annual average. A couple paying the evening price would spend 70 cents before travel or refreshments.
Sources: Valencia Theatre, Baltimore: reproduced 1929 advertisements
Buying a new Model A Ford
| Body style | Advertised base price, FOB Detroit |
|---|---|
| Roadster | $435 |
| Phaeton | $440 |
| Standard Coupe | $500 |
| Tudor Sedan | $500 |
| Fordor Sedan | $600 |
| Sport Coupe | $530 |
| Cabriolet | $645 |
| Town Sedan | $670 |
| Town Car | $1,200 |
| Taxi | $800 |
These prices exclude accessories, transportation to the buyer’s locality and dealer additions. They are historical list-price examples, not guarantees of an unchanged price throughout the year. A used Ford might cost less, while financing added obligations. Some commercial body prices are not available in the cited list; no guessed pickup or AA truck price has been substituted.
Sources: Model A Ford Club of America: Prices When the Model A Was New
Ford expanded the Model A family with choices such as the Cabriolet and Town Sedan. Buyers could select open-air motoring, an enclosed family car or a much more expensive formal Town Car. The 1929 price list therefore shows both mass-market transportation and customers willing to pay for greater comfort and status. By the time the market crashed, the Model A had already been introduced and established in production; the crash affected subsequent demand, not its original unveiling.
Sources: The Henry Ford: Henry Ford, Post-Model T
Putting the price in household terms
A $500 Tudor was a major durable purchase, unlike a few cents spent on bread. The buyer had to consider the down payment, future installments, running costs and the chance of keeping a job. Even a price that looked modest beside a house could represent months of saving. Price tags alone do not tell us who could afford the car.
The differences between bodies mattered in daily use. A closed sedan could serve a family in bad weather; an open roadster traded some protection and passenger space for a different experience. Delivery and truck bodies put the same broad Ford family into business use. See the club’s Model A Body Styles page for pictures and descriptions of passenger and commercial vehicles.
Homes, rent and the cost of a place to live
A late-1920s home buyer needed to consider both the purchase and the debt. A property could retain an asking price even when fewer buyers could qualify or had confidence to borrow. For scale, the next year’s census measured a $4,778 median reported value for owned nonfarm homes. This is a 1930 valuation benchmark—not a 1929 sale-price estimate—and half of those reported values lay below it. Catalog packages offered another route to ownership, but their price excluded important costs of a finished property.
Sources: 1930 Census, Population Vol. VI, Table 5, p. 7 · Sears Archives: home models and price ranges, 1927–1932
A catalog house package should not be compared directly with a finished house on its own lot. Freight, excavation, foundations, assembly, plumbing, wiring and local labor could change the total substantially. Renters faced a different budget: the monthly payment, heat and utilities, rather than the entire value of a building. Neighborhood and the condition of the property mattered as much as its floor plan.
Housing reference: the $4,778 figure on these pages is explicitly the 1930 census median reported value of owned nonfarm homes. It is not a measured annual national sale price for 1928, 1929 or 1931. The catalog ranges cover 1927–1932 and likewise should not be read as exact quotes for every model in every year.
What people did for a living
The Census historical series estimates 47.63 million employed people in 1929, including 10.45 million in agriculture. Its annual unemployment estimate is 3.2 percent. That annual figure blends the earlier strong months with the beginning of the downturn; it does not mean unemployment stayed unchanged after the crash. Factory and transport employment depended on orders for cars, machinery, buildings and consumer goods, making many workers vulnerable when spending slowed.
The familiar occupations of the period continued: farmers, miners, machinists, assembly workers, railroad employees, shop clerks, office workers, teachers and domestic workers. Automobile production also supported tire, glass, upholstery and parts businesses. A fall in vehicle purchases could spread beyond Ford’s own assembly line.
Sources: 1930 Census: General Report on Occupations · Census historical employment table HS-29 · BLS: how Depression-era unemployment estimates were developed
| Work setting | Examples of period jobs |
|---|---|
| Farms and food | Farmers, hired hands, dairy workers, packers and grocers |
| Industry and building | Assembly workers, machinists, miners, carpenters and electricians |
| Transport and communications | Railroad crews, truck drivers, delivery workers and telephone operators |
| Stores and offices | Sales clerks, bookkeepers, typists and stenographers |
| Homes and public services | Domestic workers, cooks, teachers and nurses |
The economy and the Model A’s place in it
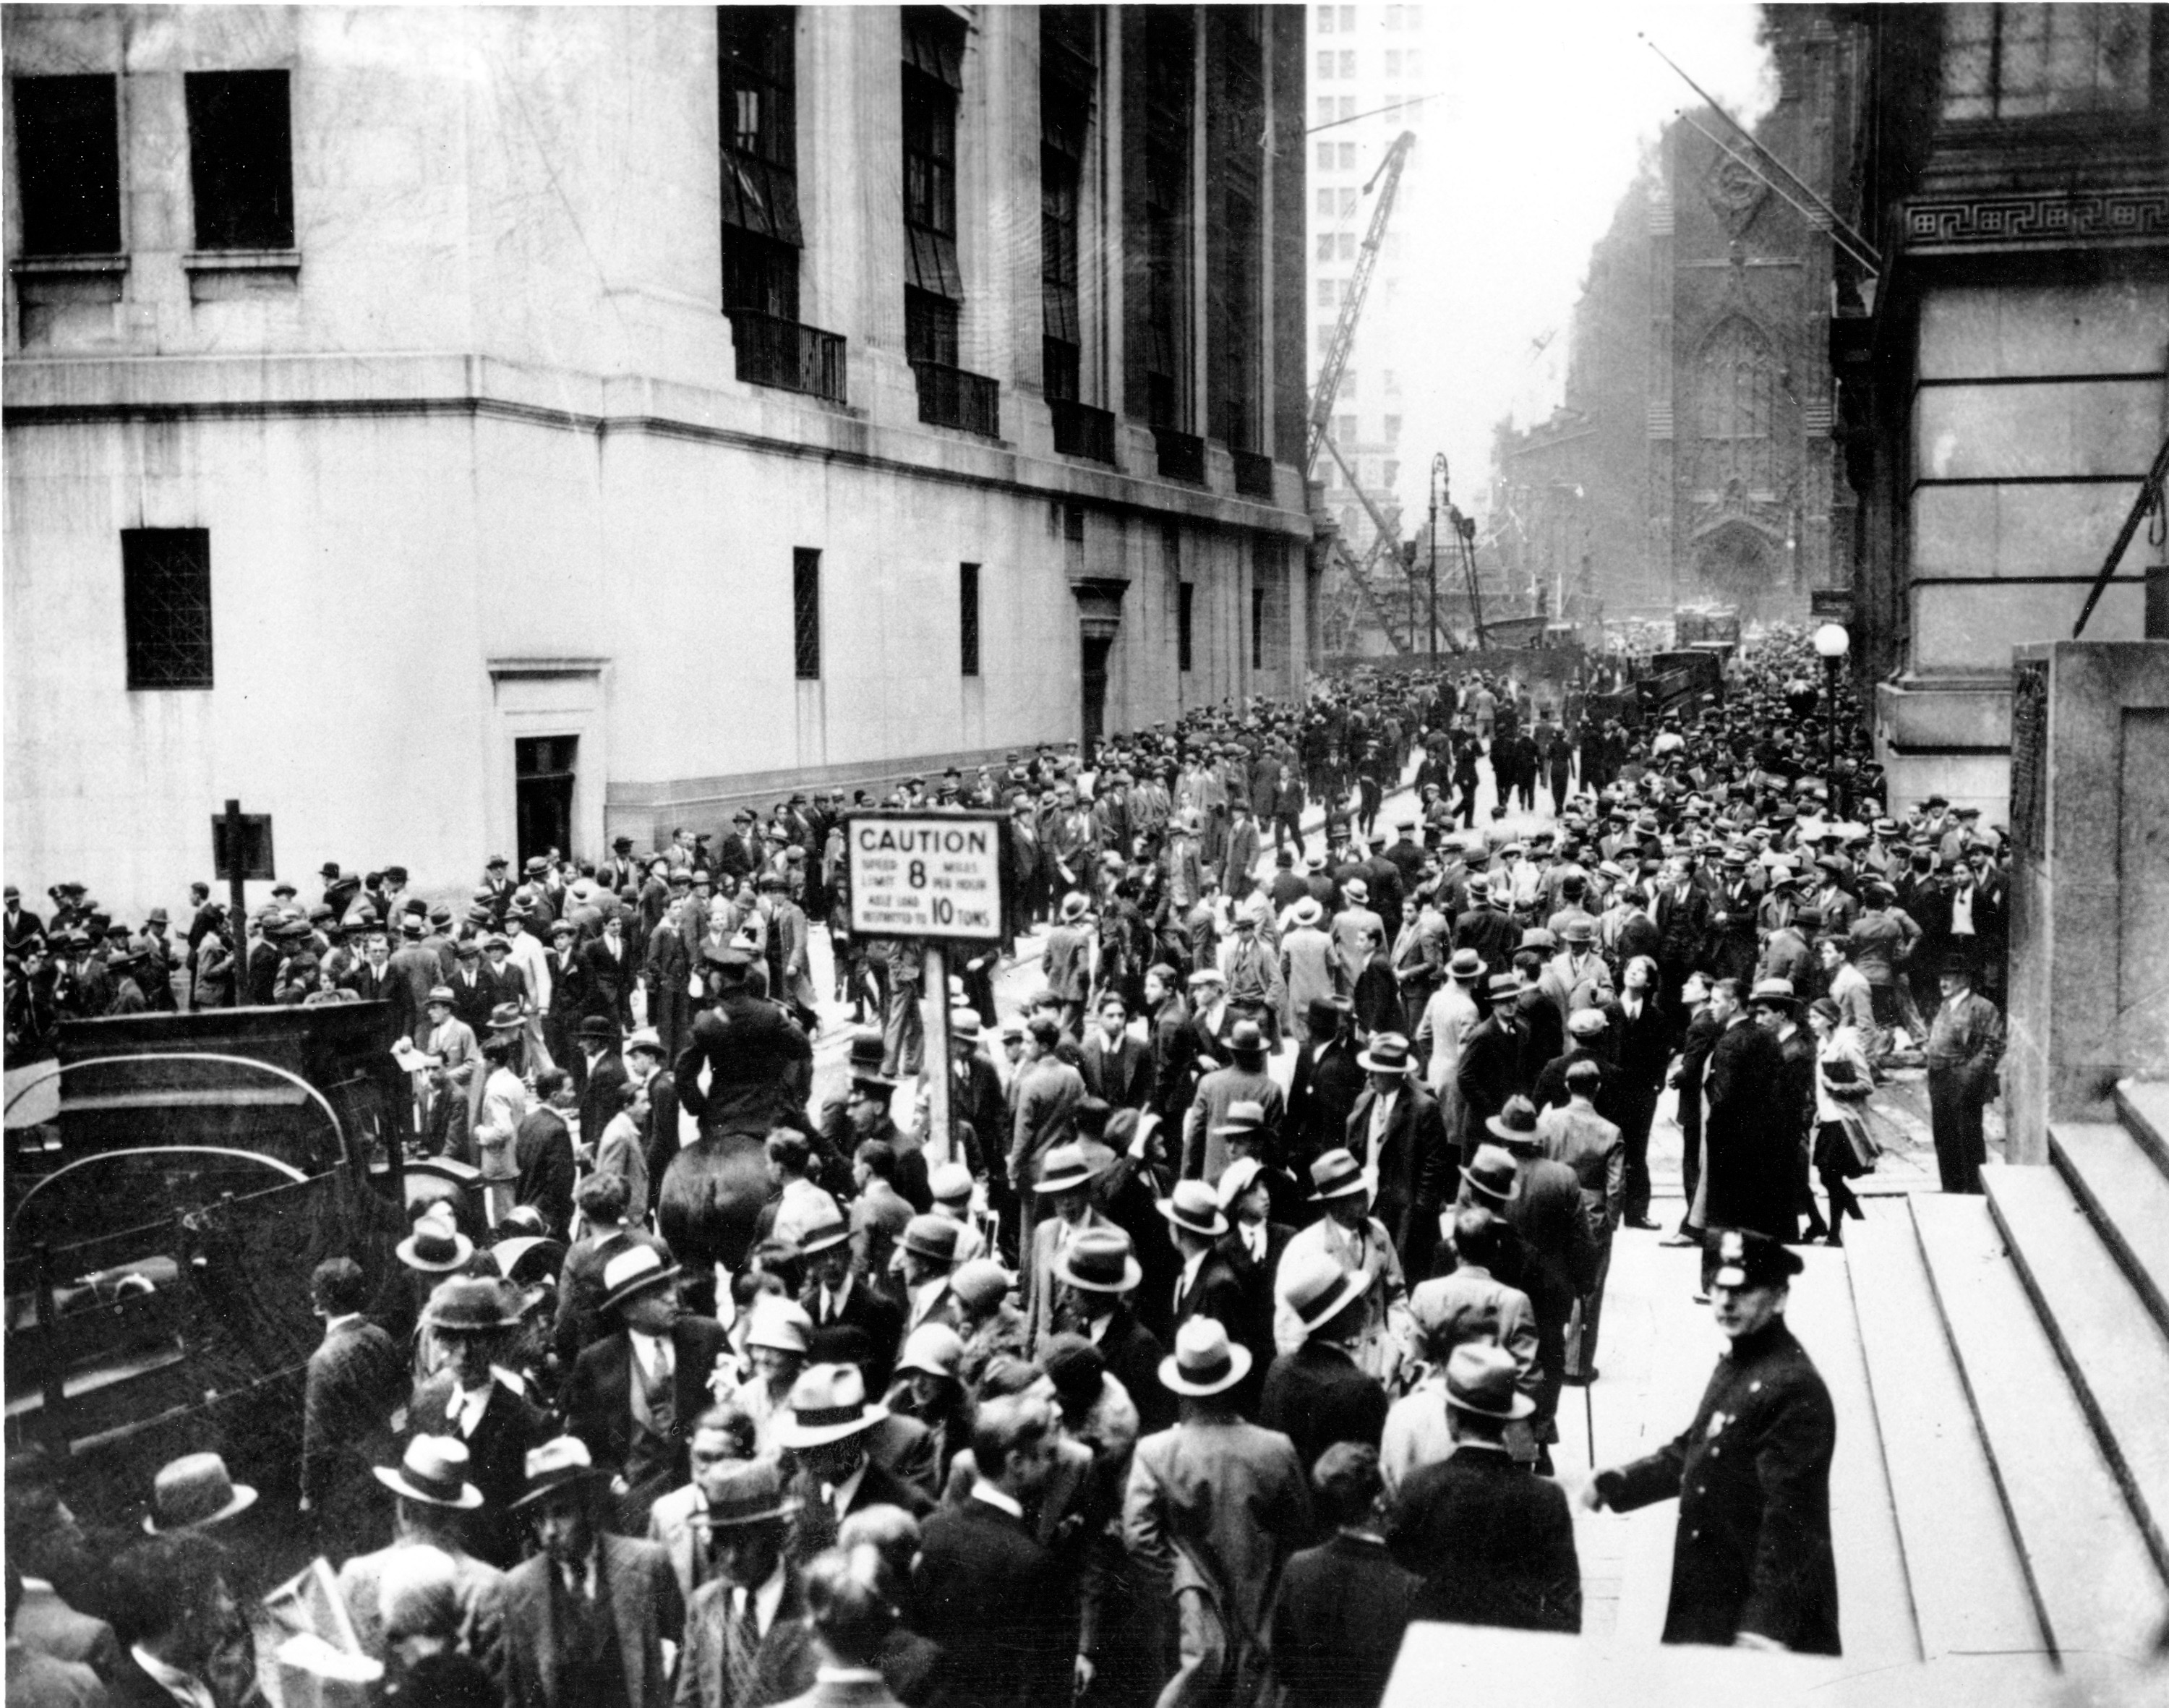
The economy’s contraction began in the summer, before the best-known days of the stock-market panic. Black Thursday, October 24, and Black Tuesday, October 29, made the collapse national news. Falling stock values damaged wealth and confidence, but the prolonged Depression also involved banking trouble, shrinking credit and policy failures. It is misleading to treat a single trading day as a complete explanation of the next several years.
Sources: Federal Reserve History: Stock Market Crash of 1929
Why cheaper goods did not always mean easier living
For a household with reliable wages, a fall in retail prices could increase what its money bought. For a household facing reduced hours, unemployment or lost savings, the lower price could still be out of reach. Deflation could also make an unchanged debt more burdensome relative to earnings. This explains why later Model A advertising and price changes cannot be judged only by the number printed beside a body style.
Crime, law and public life
On February 14, 1929, seven men associated with Chicago’s Bugs Moran gang were killed in the St. Valentine’s Day Massacre. The FBI describes the attack as generally attributed to the Capone organization, while noting that Al Capone himself was in Florida. That distinction matters: notoriety and attribution are not the same as a personal conviction for a specific murder. The case illustrates violent competition for illicit markets during Prohibition, which preceded the Depression.
Sources: FBI: Al Capone
Crime stories were prominent in the press, but a notorious case is not a statistical measure of ordinary life in every town. Organized crime, property crime, corruption and racial violence need separate attention. Nor should hardship be treated as proof that unemployed people were criminals. The early national reporting system’s limits make sweeping year-to-year claims particularly risky.
Sources: FBI historical timeline: national crime reporting in 1930
Facts and dates from the year
- May 16: The first Academy Awards took place at the Hollywood Roosevelt Hotel in Los Angeles. Sound films were changing both entertainment and the local movie industry.
- February 14: the St. Valentine’s Day Massacre in Chicago.
- October 24 and 29: the best-known panic days of the stock-market crash.
- Annual unemployment estimate: 3.2 percent, reconstructed later by BLS.
Sources: Academy of Motion Picture Arts and Sciences: Oscars on the Air · FBI: Al Capone · Census historical employment table HS-29
A look at the original grocery record